
OPERATIONAL EFFICIENCY
Operational efficiency is fundamental to the success and sustainability of modern businesses. At Qatar Steel, we strive to ensure operational efficiency by focusing on three key factors: plant modifications to increase efficiency, optimisation of maintenance management, and integration of health, safety, and environmental safeguard measures.
To increase overall efficiency, we regularly implement strategic plant modifications that aim to enhance our production processes while also minimising waste. Moreover, optimising maintenance management practices ensures that our equipment remains reliable which not only reduces downtime but also extends the lifespan of our assets. Finally, our health, safety, and environmental safeguard measures protect our employees and the environment while mitigating potential risks and liabilities. In 2023, Qatar Steel implemented several improvements and achieved several key milestones in our plants including:
Iron Making (Direct Reduction -2):
• Procured CDRI stockpile measurement Equipment using LIDAR technology for accurate measurements and to reduce the possibility of CDRI/HBI Physical stock taking errors.
• DR2 plant operated for 336.39 days in the year (28.61 days of shutdown).
• HOT Natural Gas addition to the furnace lower cone to improve the carbon in DRI.
• Modifications in HBI system to improve the HBI operation.
• Back up natural gas line provision for the reformer auxiliary burners to minimise cold shutdowns.
Steel Making:
• 70m3 big basket project received and commissioned successfully and introduced in normal operation from 18th August 2023.
• Auto slag door project installed, and it is under evaluation Performance Guarantee Test.
• New record of daily production of 4038 ton/day on 15th April 2023
• New record of monthly productivity of 105957 tons/month during December 2023.
• New record of EF shell refractory of 1,204 heats in September 2023.
Rolling Mill:
• Awarded the 1st prize in the Qatar Steel HSE Safety Award.
• New daily production record made on 15.03.23 by producing 3467 Tons against the previous record of 3451 T made on 11.11.22.
• New size wise daily production records established in D12mm, D14mm, D16mm, D18mm, D20mm, D25mm and D32mm.
• A total of ten new size records achieved during 2023.
• Using innovative in-house modification techniques to convert 420-mm scraped cast rolls into 360-mm cast rolls, achieving standard new life performance.
Lime Calcination Plant & Briquetting Plant:
• The plant automation system was successfully upgraded to the latest version available.
• A permanent working access platform was provided for improving the safety in the plant and optimising scaffolding cost.
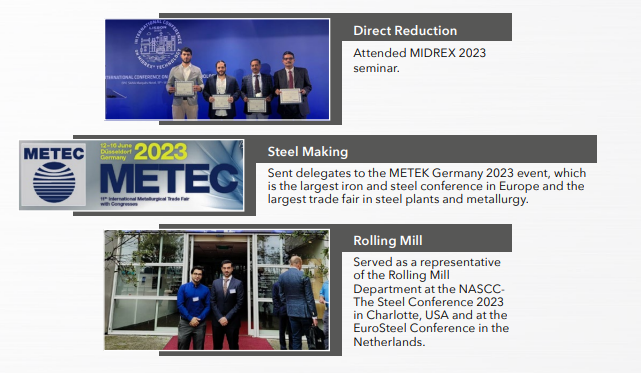
Events Attended: